In the world of operations, finance, and people don’t live in siloes. For organisations to run smoothly, especially in technical, fast-moving environments, it’s critical to monitor Key Performance Indicators (KPIs) that reveal how efficiently resources are used, cash is converted, processes flow, and costs are managed. In this blog, we’ll unpack four vital operations KPIs:
- Days Payable Outstanding (DPO)
- Days Sales Outstanding (DSO)
- Cycle Time
- Percentage Cost Overrun
We’ll look at what they are, why they matter (for both technical and business readers), real-world pain points, and how PeopleOps & operational teams can help improve them.
1. Days Payable Outstanding (DPO)

What is DPO?
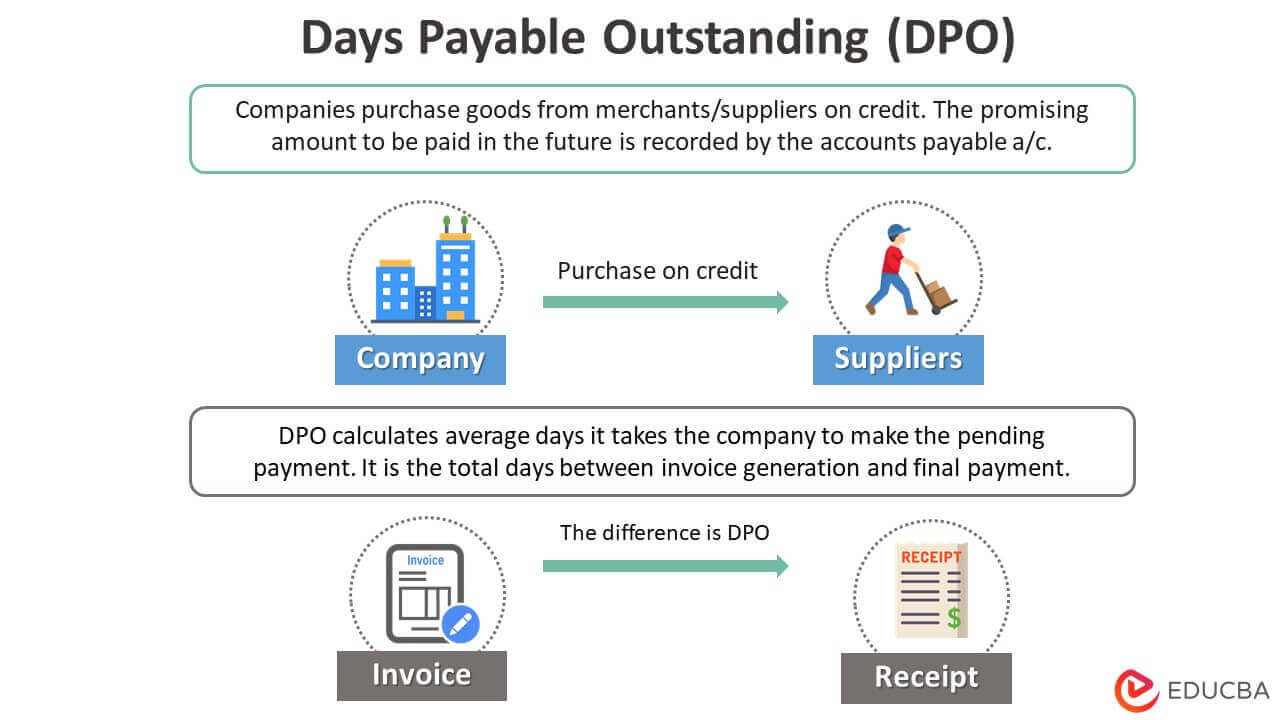
DPO measures the average number of days a company takes to pay its suppliers after receiving goods or services. Cube Software+1
In formula form:
DPO = (Average Accounts Payable ÷ Cost of Goods Sold per day) × Number of Days Wikipedia
Why it matters
- From a cash flow perspective: A higher DPO means you hold onto cash longer before paying suppliers, giving you more working-capital flexibility. Centime+1
- From an operations/people angle: Supplier relationships matter. Stretching payment terms too much without negotiation may impact trust, delivery, or terms in future.
- From a financial planning lens: It feeds into the broader cash-conversion picture alongside DSO and inventory metrics (via the cash conversion cycle). Investopedia+1
Common pain-points
- Teams are not tracking payables age by vendor or term, so late payments or missed discounts happen.
- Procurement and finance operate in silos, so supplier payment terms are not negotiated optimally.
- There’s a temptation to push DPO too high without considering supplier risk or downstream impact (e.g., stockouts).
- Lack of visibility: operations committing purchases but finance not aware in time to plan cash-flow.
How PeopleOps & operations can help
- Align procurement, finance, and operations on supplier → payment term dashboards.
- Negotiate supplier terms smartly: e.g., net 30 vs net 45 vs net 60, factoring in volume, reliability and supplier risk.
- Monitor DPO trending by vendor, division or category (so you can spot if one area is abusing terms).
- Integrate vendor performance KPIs (on-time delivery, quality) with payment-term strategy: paying later might make sense if supplier is stable and reliable, but not if delivery suffers.
Real-world scenario
Imagine a manufacturing firm where the operations team orders critical components monthly. The finance team notices that payables are consistently paid in 60 + days (DPO ≈ 60). Meanwhile, several suppliers are late on delivery because they’re stretched for cash. In this case, a high DPO may be hurting supplier performance and creating stock-out risk. The PeopleOps/Operations leadership intervenes: they negotiate net 45 payment terms with preferred suppliers in return for guaranteed delivery, monitor supplier performance dashboards, and bring DPO to 45 days while improving delivery reliability.
2. Days Sales Outstanding (DSO)


What is DSO?
DSO measures how long it takes, on average, for a company to collect payment from customers after a sale. The lower the DSO the faster cash is coming in. Cube Software
Formula example:
DSO = (Average Accounts Receivable ÷ Total Credit Sales) × Number of Days
Why it matters
- High DSO means cash is tied up in receivables, reducing flexibility and increasing risk (e.g., bad debt, delayed projects).
- For PeopleOps/ops teams: sales, billing, credit and collections need to align. Slow billing or poor follow-up means DSO creeps up.
- DSO is a critical part of the cash conversion cycle (which also includes DPO and inventory). Centime+1
Common pain-points
- Billing is delayed because ops delivered the service but invoice wasn’t generated.
- Credit terms are too generous (e.g., net 90) in competitive environments, leading to long DSO.
- Lack of automation in receivables follow-up or insufficient credit-control staffing.
- Disconnect between sales and finance: sales gives extended credit without evaluating risk or cash-flow impact.
How PeopleOps & operations can help
- Implement process mapping: from service delivery → invoice → payment. Identify bottlenecks.
- Set target DSO (e.g., 30 days) and review weekly/monthly. Highlight business units or clients where DSO is high.
- Introduce early-payment incentives or penalties for late payment (while balancing customer relationships).
- Use dashboards in which billing, collections and operational leads see DSO trends and overdue ageing reports.
Real-world scenario
A SaaS company offers net 60 payment terms to new enterprise customers. Over time, their DSO drifts to 55 days (90th percentile). The ops team realises delivery is underbilling because contract changes are manually processed. They automate change-order billing, bring average invoice generation time from 10 days to 2 days, reduce DSO to 30 days, freeing up €1 M in working capital.
3. Cycle Time
What is Cycle Time?
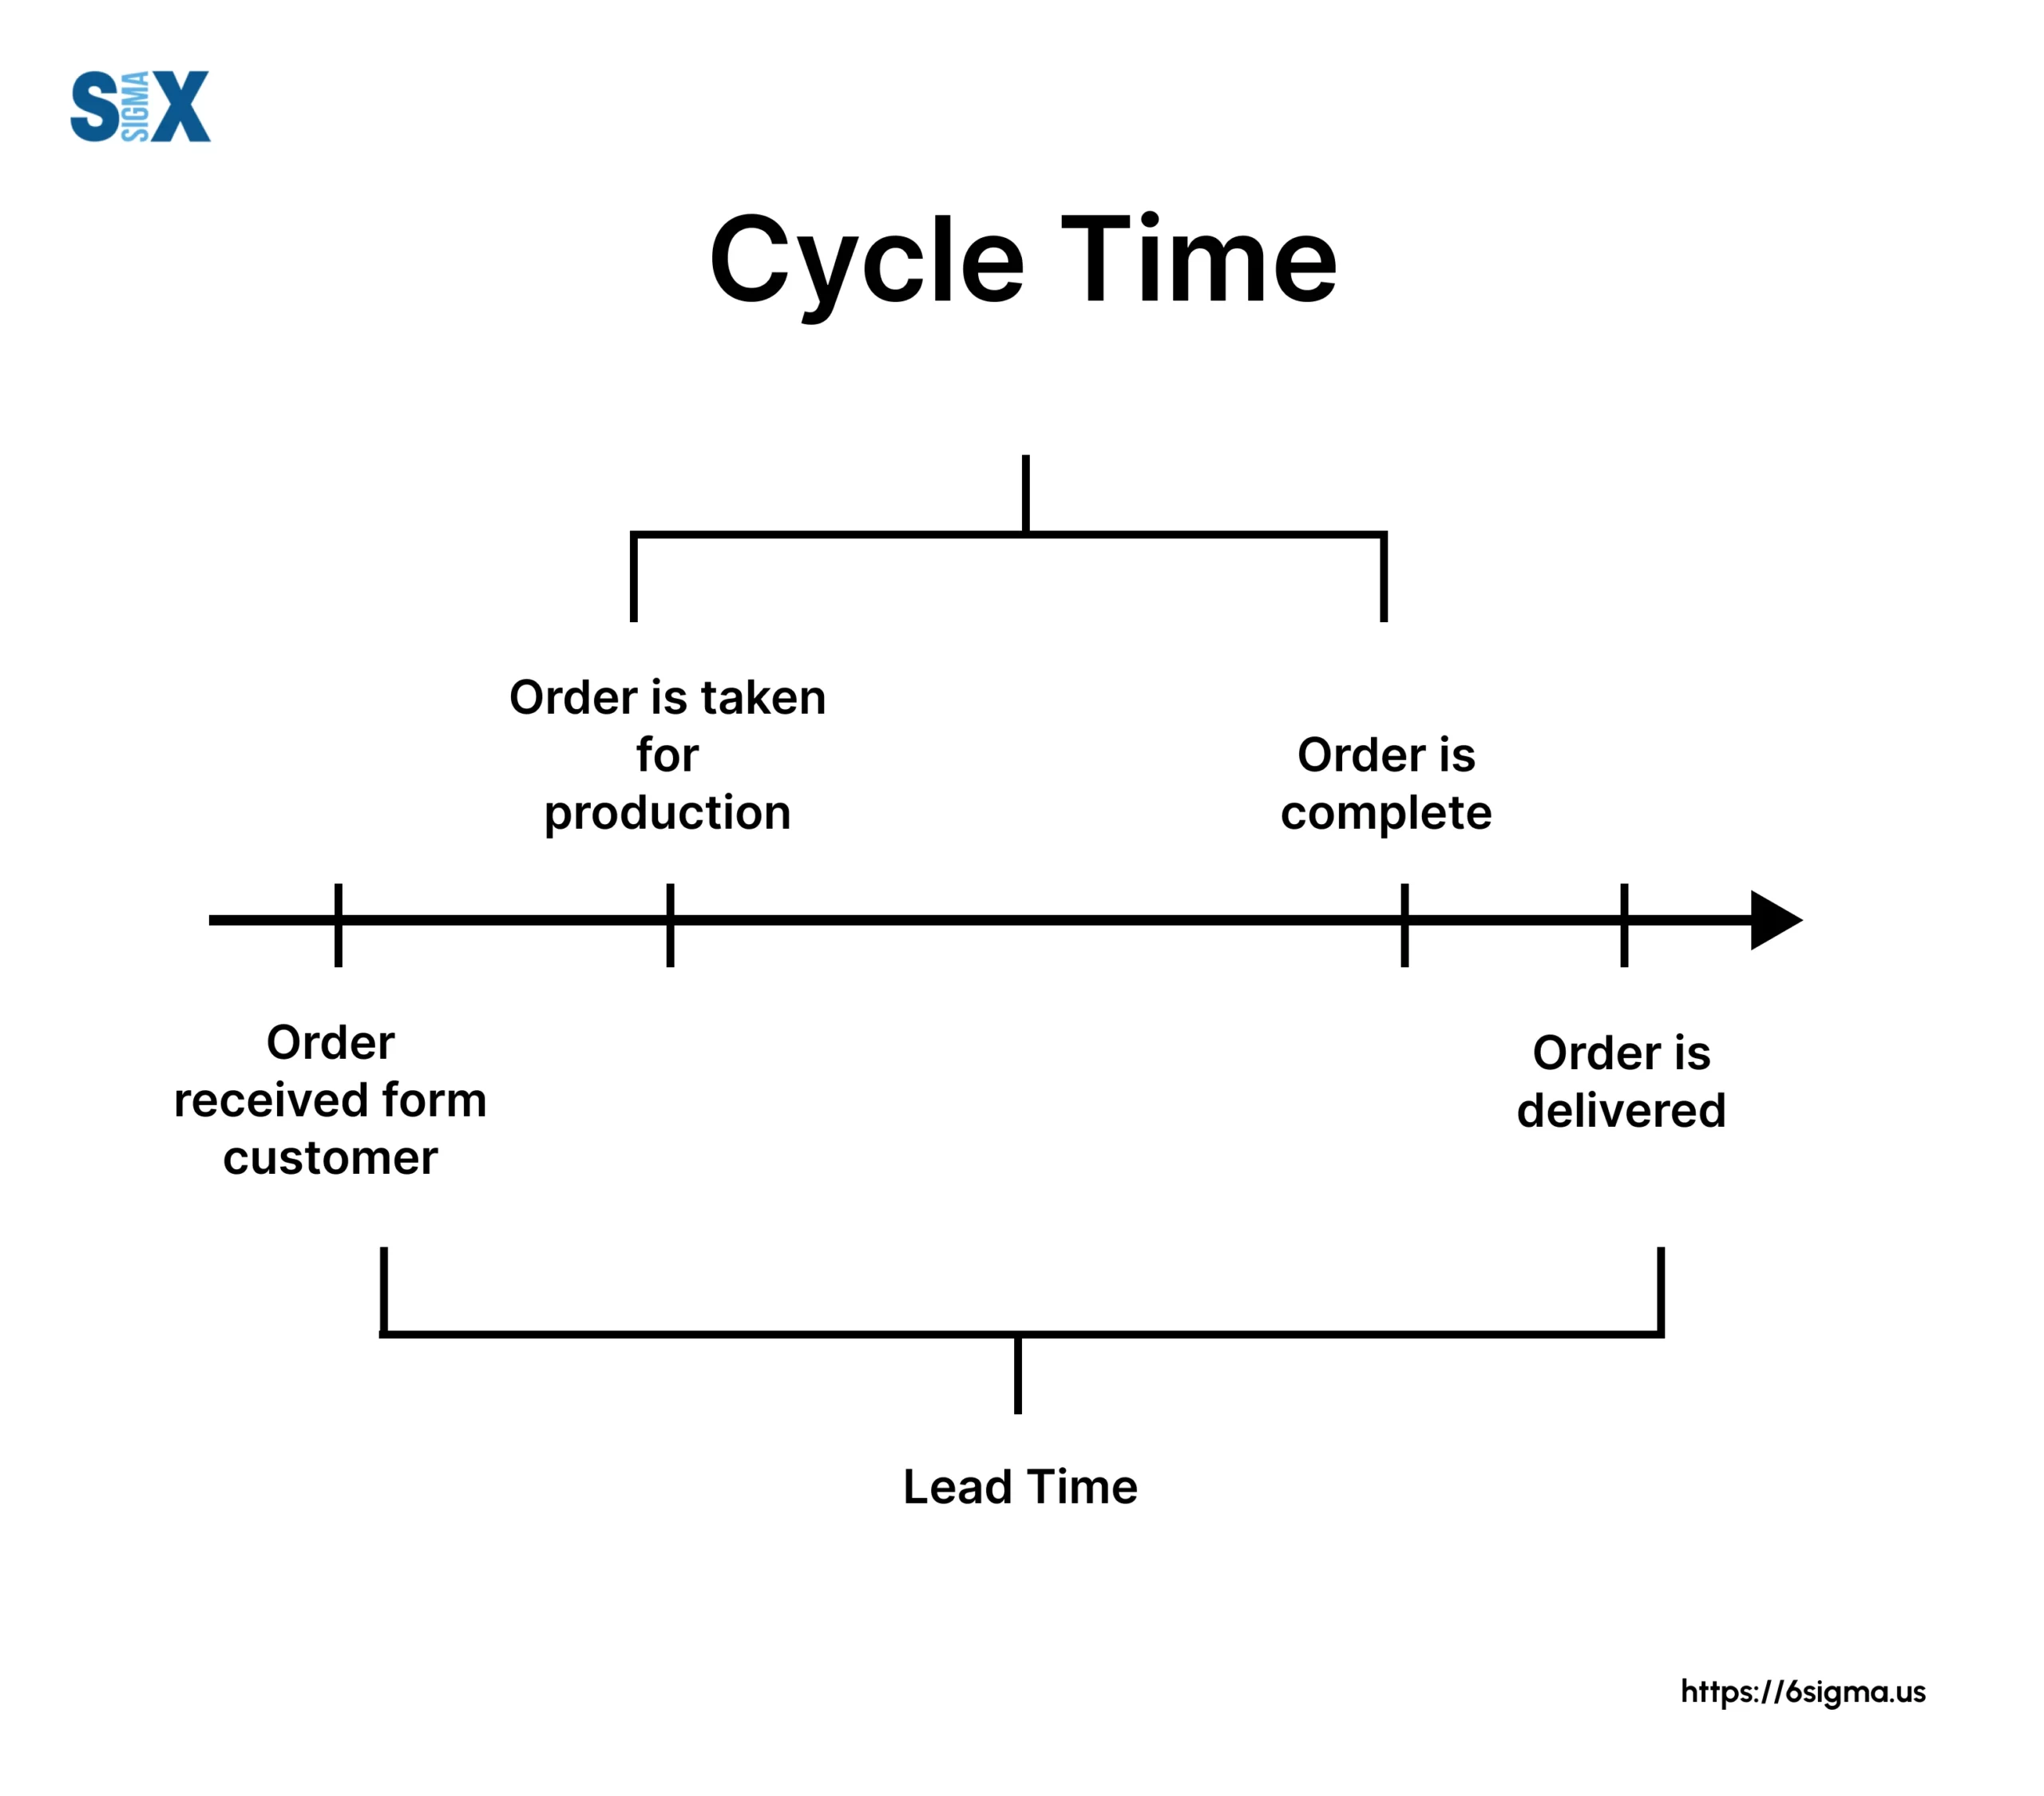
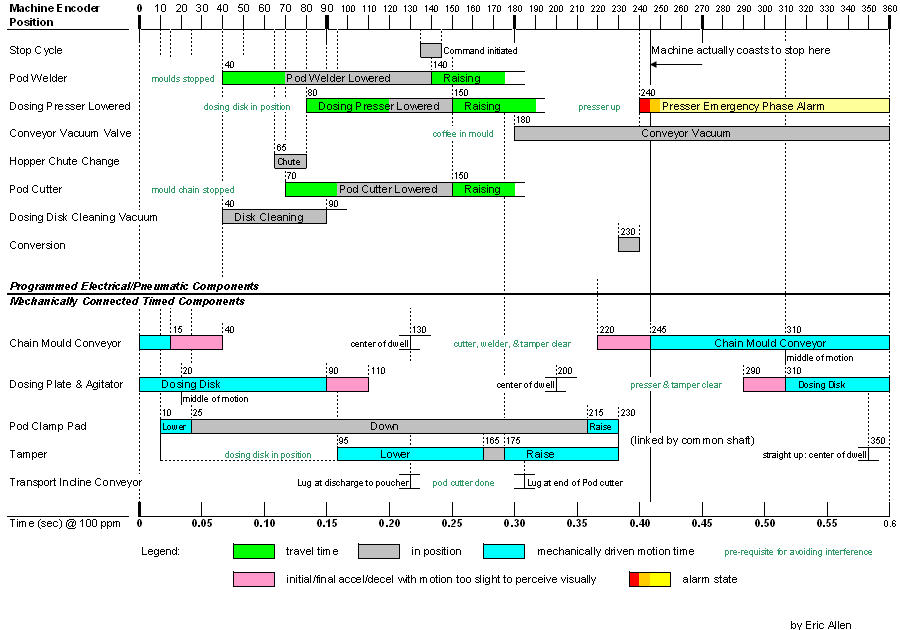
Cycle time refers to the time it takes to complete a process from start to finish. This could mean order fulfillment, product manufacturing, service delivery, or software release. MoreThanDigital Insights It’s often a leading indicator of operational efficiency.
For example: “How many days from customer order to delivery?” or “How many hours from request to deployment?”
Why it matters
- Shorter cycle time = faster delivery, lower waste, better customer satisfaction.
- In PeopleOps context: it links operations, technology, and people. Efficient process design + right staffing + good tech = shorter cycle times.
- From a finance view: shorter cycle time often means less cash tied up, less WIP (work in process), faster revenue recognition. Phoenix Strategy Group
Common pain-points
- Organisations treat cycle time as a by-product rather than actively measured, so visibility is poor.
- Process handoffs (e.g., from ops → finance → procurement) are weak, causing delays.
- Lack of process standardisation or automation (especially in newer tech/AI initiatives).
- PeopleOps may be unaware that staffing or onboarding delays are causing process bottlenecks leading to long cycle times.
How PeopleOps & operations can help
- Map the process end-to-end (e.g., order → build → test → deliver) and identify “time in handoff” and “time in queue” vs “time in work”.
- Set cycle-time targets by process type and review monthly.
- Use automation and standard work to minimise delays, e.g., auto-assign tasks, auto-notify handoffs.
- Align people (training, clarity of roles), technology (tools to support handoff), and process (clear SLAs) to reduce non-value time.
Real-world scenario
An operations team in a hardware manufacturer tracks “order to delivery cycle time”. It’s averaging 28 days, driven by slow scheduling of engineering tests and delayed procurement of parts. PeopleOps partners with operations to create a “fast lane” team for critical orders (with dedicated staffing and procurement priority), reducing cycle time to 14 days and boosting customer satisfaction.
4. Percentage Cost Overrun (% Cost Overrun)


What is % Cost Overrun?
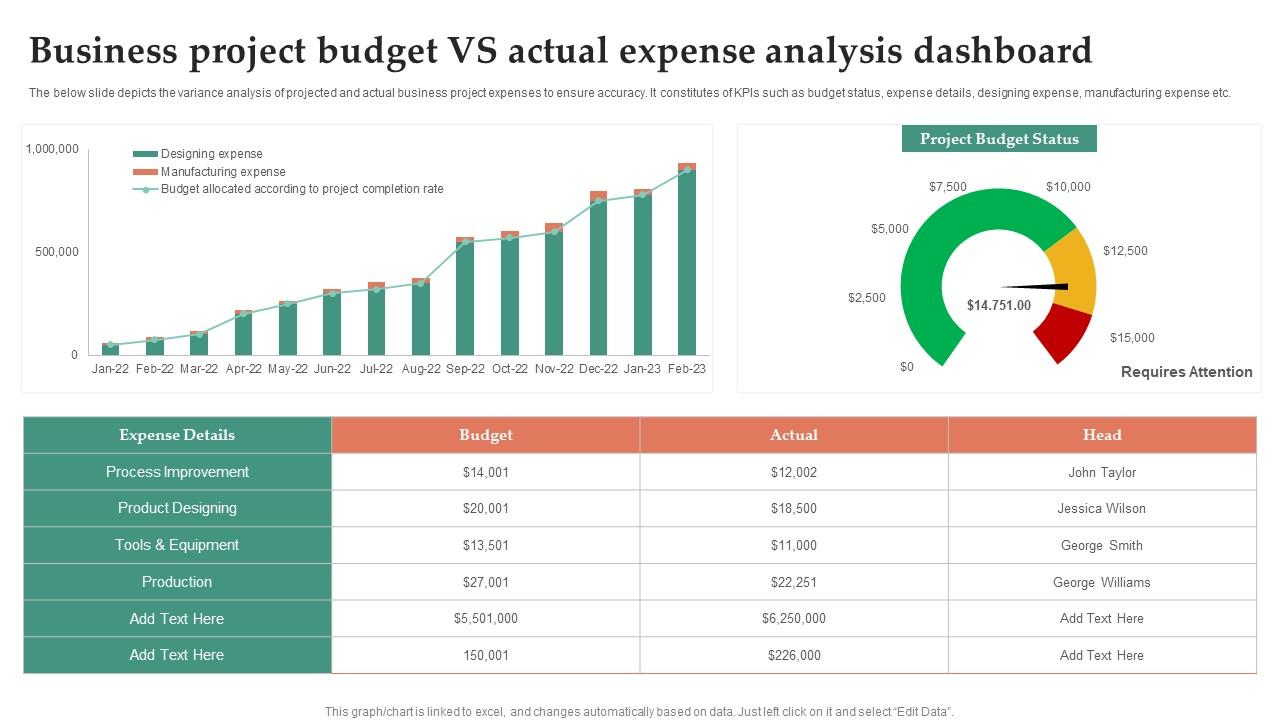
% Cost Overrun is a financial indicator showing how much actual costs exceed the planned budget, expressed as a percentage. For example: if budget was ₹100 lakh but actual cost is ₹120 lakh, then the cost overrun is (20/100)×100 = 20%.
Cost overrun is a common problem in large projects and operations initiatives. Wikipedia+1
Why it matters
- From the business/finance side: over-budget operations projects mean less ROI, tighter margins, potential strategic risk.
- From PeopleOps/operations side: cost overruns often point to process inefficiencies, scope creep, resourcing issues, or weak risk management.
- For technical teams: if you’re implementing new tech (e.g., AI, SaaS integration), cost overruns often emerge because of under-estimated complexity, poor change control, or resource ramp-up delays.
Common pain-points
- Initial estimates are too optimistic, or critical risks were not included (especially in innovative or first-time initiatives).
- Scope creep: new features or deliverables added without re-baseline of budget.
- Resource misallocation or frequent switching of team members increasing ramp-up costs.
- Poor monitoring: teams only check cost at the very end rather than continuously tracking budget vs actual.
How PeopleOps & operations can help
- Establish baseline budgets and agree cost-overrun thresholds (e.g., no more than +10 %).
- Regular “health-check” meetings with ops, finance and PeopleOps stakeholders to review budget vs actual & alert if variance exceeds threshold.
- Use past internal data or industry benchmarks to set realistic estimates (and include contingency).
- Ensure change control: if scope changes, update budget, get approvals, and reflect in expected cost.
- From PeopleOps side: ensure onboarding pace, resource allocation, skill mix are optimised (since cost overruns often accrue because team ramp is slower or mis-skilled).
Real-world scenario
An IT-operations transformation project in a services firm estimates cost at ₹50 cr. Mid-execution, scope is expanded to include new automation modules. But the budget isn’t updated. At project close, costs total ₹65 cr (30% overrun). PeopleOps learns from this that resource ramp-up was slower, scope changes weren’t formally captured, and there was duplication of effort. For the next project, they build in a +15% contingency, formal change-control process and bi-weekly budget tracking. Cost overrun in next project is limited to +5%.
Bringing It All Together: Integrated View
These KPIs don’t live in isolation, they feed off each other and together paint a picture of operational health:
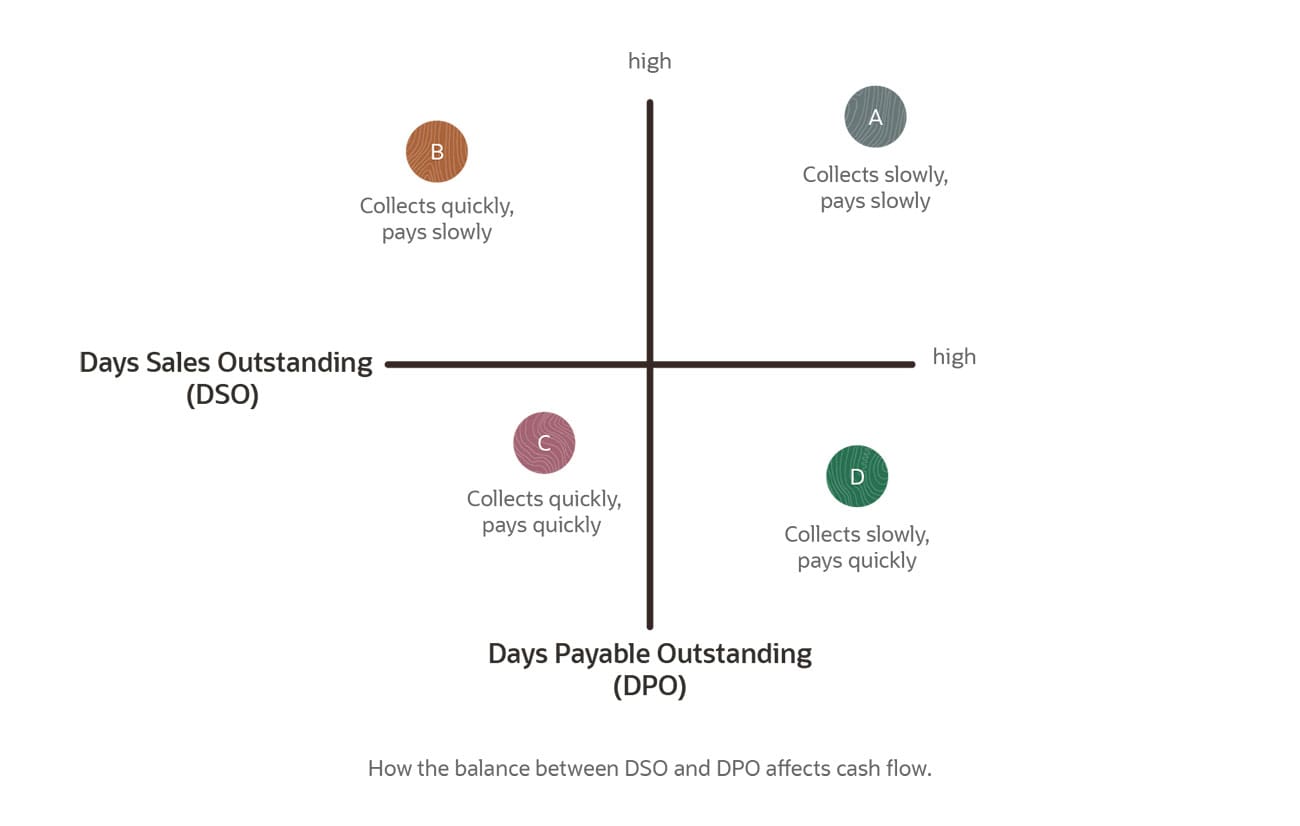
- DSO (cash in) + DPO (cash out) + cycle time (process speed) + cost‐overrun (budget discipline) all contribute to working capital, efficiency, and organisational agility.
- For example, a company may have excellent DPO (long supplier terms) but if cycle time is very long (slow process) and DSO is also high (slow collections), cash is still tied up.
- Likewise, a transformation project may be delivered on short cycle time but if cost overrun is high, the benefit becomes questionable.
How PeopleOps should approach this
- Dashboarding – integrate finance/ops dashboards that track each KPI, with alerts when thresholds are breached.
- Cross-functional teams – PeopleOps bringing together People, Ops, Finance and Technology ensures alignment on these metrics and their human implications (staffing, training, incentives).
- Benchmarking & targets – Use industry/peer benchmarks and internal historical data to set realistic targets.
- Continuous improvement culture – Review these KPIs regularly (monthly/quarterly) in joint meetings, analyse root causes of deviation, and implement corrective actions (training, process redesign, automation).
- Link to strategy – Tie these operational KPIs back to business goals: faster delivery, lower cost, improved cash flow, better margin, higher customer satisfaction.
Summary & Takeaways
- DPO – Manage your payable terms smartly: hold cash when possible but don’t damage supplier relationships.
- DSO – Get paid faster: streamline billing, credit control and collections with operations alignment.
- Cycle Time – Process speed is key: shorter cycle means faster delivery, less waste, better cash-flow.
- % Cost Overrun – Budget discipline matters: plan realistically, monitor continuous, manage scope.
- For PeopleOps, the role is not just HR: it’s enabling teams, processes, systems and culture that drive these KPIs.
- These KPIs are not only for finance teams; they matter for operations, technical teams, people teams and senior business leaders.
Final thought
In a rapidly changing operations environment, whether you’re scaling cloud services, automating workflows, delivering SaaS integrations or managing heavy supply-chain networks, these KPIs matter. They give you insight, actionable leverage and a bridge between finance, operations and people. As PeopleOps professionals, by embedding clarity around DPO, DSO, Cycle Time and % Cost Overrun, you help your organisation move faster, leaner and smarter.
Leave a Reply