
In today’s fast-moving business environment, organisations need live, reliable insights from their accounting data, no more waiting for manual exports, outdated spreadsheets or disconnected systems. For teams in People Operations (PeopleOps) as well as finance and business leadership, being able to access the right metrics at the right time is critical.
In this blog we’ll explore how bridging your accounting platform QuickBooks Online (QBO) with Excel via Spreadsheet Sync, and then building custom dashboards, can transform your reporting workflows. We’ll dive into the pain points, show how the technology works, and explain how your PeopleOps or business-leadership team can benefit from real-world scenarios.
The problem and pain points
Disconnected systems & manual processes
Many organisations still work this way:
- Month-end closing, someone exports reports from QBO, downloads CSVs, pastes into Excel, formats, sends to stakeholders.
- Sales, payroll, expense, head-count data all live in separate systems, maybe HRIS, maybe QBO, maybe spreadsheets.
- Dashboards are built manually, often copying/pasting, maintaining formulas, reconciling again and again.
- Errors creep in: outdated numbers, mismatched formats, stale data.
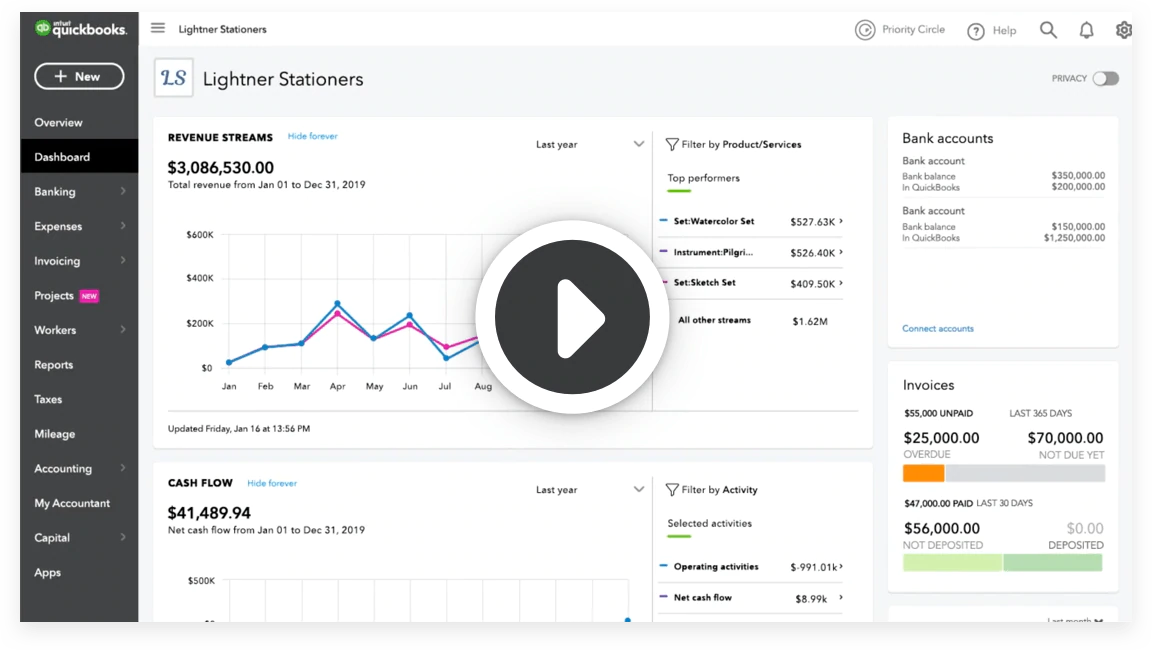
Lack of real-time visibility
- Business leaders ask: “What’s our current cash flow? Are our labour costs rising this quarter beyond budget?” But the data is lagging.
- PeopleOps wants to link HR metrics (headcount, turnover) with cost metrics (salary expense, benefits expense) but it’s hard because the finance data and HR data are siloed.
Reporting workload & scalability
- The finance or PeopleOps team spends too much time just preparing data rather than analysing it.
- When you have multiple entities, multiple cost centres, or multiple countries, consolidation becomes a major headache.
- Changing requirements (new metrics, new cost centre structures) mean dashboards break, get outdated, and require manual rectification.
Stakeholder expectations
- Non-technical or business stakeholders expect visually intuitive dashboards (charts, KPIs) that update automatically.
- They don’t want to wait for the next month’s static report, they want to see “live” or near-live data, with easy drill-down.
Enter Spreadsheet Sync & Custom Dashboards
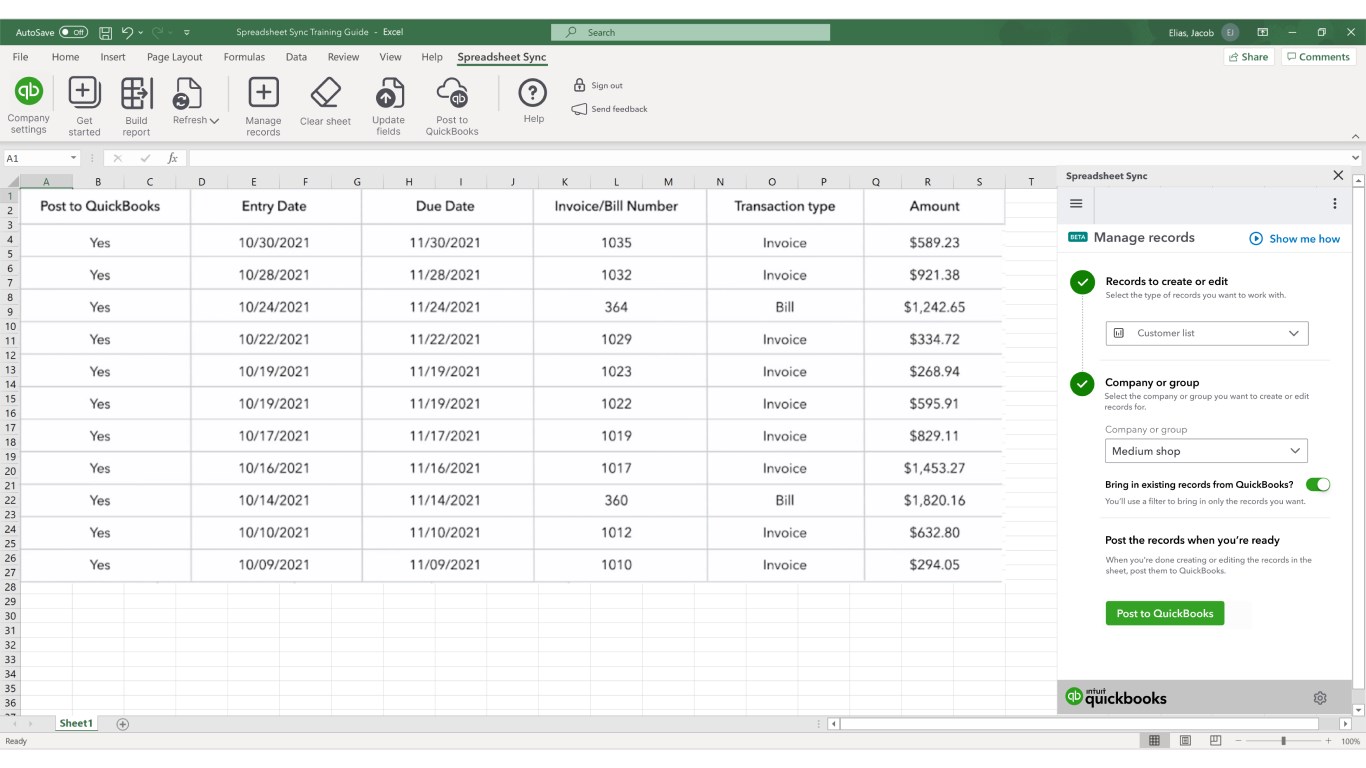
What is Spreadsheet Sync?
Spreadsheet Sync is a native Excel add-in offered by Intuit for QuickBooks Online Advanced accounts. According to Intuit:
- You can securely send data back and forth between QBO Advanced (or QBO Accountant) and your spreadsheet. QuickBooks+1
- You can create reports the way you want, use spreadsheets to create custom charts/graphs using QBO data. QuickBooks+1
- It supports large-batch data edits in Excel which can then sync back into QBO. QuickBooks+1
- It supports multi-company reporting (for organisations managing multiple entities) through the spreadsheet interface. QuickBooks+1
How Custom Dashboards come into play
Once you have QBO data flowing into Excel via Spreadsheet Sync, you can build dashboards:
- Use pivot tables, slicers, charts, Power Query or Excel’s native modelling to shape the data.
- Create KPI cards (eg: revenue growth, cost per hire, turnover rate, benefit cost per employee) which update when the data refreshes.
- Use filters or drill-downs to let business leaders or PeopleOps explore by department, location, time period.
- Combine QBO financials with HR/people metrics (e.g., headcount by department, training costs, attrition) in a single dashboard for the PeopleOps/finance crossover view.
Real-world scenarios in PeopleOps & Business
Scenario 1: Headcount & Cost Control
A mid-sized tech firm has offices in Pune, Bangalore and a US branch. The PeopleOps team wants to monitor:
- Employee count by location and department monthly.
- Salary and benefits cost per head by location.
- Budget vs actual labour cost and forecast for the next quarter.
By using Spreadsheet Sync:
- Finance exports payroll cost data via QBO into Excel automatically.
- PeopleOps exports headcount and attrition data from their HRIS into a second sheet.
- A dashboard is built that shows cost per head, cost growth, attrition rate and overlays these with the budget.
- The CEO can open the dashboard weekly and see if a cost hotspot is emerging or if attrition is creeping up in a specific office.
Scenario 2: Multi-entity Consolidated Reporting
A parent organisation has three subsidiaries in APAC and one in Europe. Finance needs to produce a consolidated P&L and Balance Sheet and also show segment-by-segment performance for the board.
Using Spreadsheet Sync:
- Each subsidiary’s QBO file is connected via Spreadsheet Sync into its own Excel sheet.
- Data is standardised (account names aligned) and then loaded into a master workbook.
- Dashboards provide the consolidated view, plus interactive slicers for region, business line, currency.
- Because the data refreshes automatically, the board gets an up-to-date snapshot rather than waiting days for manual consolidation.
Scenario 3: PeopleOps Metrics for Business Growth
A SaaS company is scaling fast, focusing on “hire to onboard to product usage” cycle. PeopleOps needs to provide dashboards showing:
- Time to fill roles, cost of hire, new hire attrition within 90 days.
- Link hiring costs (from finance via QBO/Spreadsheet Sync) with business KPIs (from internal systems) to show how hires are impacting revenue growth.
- Create visual dashboards for the leadership team: e.g., “cost per new hire”, “new hire contribution”, “training cost vs revenue per employee”.
By combining Spreadsheet Sync (for financial data) and Excel dashboards (for people metrics) you get a unified view, enabling PeopleOps to show direct linkage of hiring investment to business outcomes.
How PeopleOps can partner with Finance & Technology
Establish cross-functional collaboration
- PeopleOps, Finance and IT/Systems teams should jointly define which metrics matter: e.g., cost per employee, benefits cost, hiring pipeline, attrition rate, revenue per employee.
- Design the data flows: identify which data lives in QBO (costs, salaries, benefits), which lives in HRIS (headcount, attrition), which lives in CRM/business system (revenue, usage).
- Set governance and ownership: ensure data refresh processes, access controls, dashboards access.
Define dashboard architecture
- Determine key dashboards: e.g., “PeopleOps Executive Dashboard”, “Finance & PeopleOps Cost Control Dashboard”, “Business Growth Dashboard by Employee Metrics”.
- Plan for drill-downs (e.g., by department, by location, by time period).
- Ensure design uses slicers, charts, conditional formatting so non-technical users can easily interpret.
Implement using Spreadsheet Sync + Excel
Steps you might follow:
- In QBO Advanced, enable Spreadsheet Sync. QuickBooks+1
- In Excel, install the Spreadsheet Sync add-in: go to Home → Get Add-Ins → search “Spreadsheet Sync”. LiveFlow+1
- Sign-in with QBO credentials, select the company, pick the report or template. QuickBooks+1
- Choose filters (date range, entity, cost centre). Run report to bring data into Excel. QuickBooks+1
- Build Excel dashboards: use pivot tables, charts, slicers; link to sheets with HR or business data.
- Set up automatic refresh (Spreadsheet Sync supports automatic refresh when workbook opens) so dashboards stay current. QuickBooks+1
- Share dashboards via Excel Online/Teams or export to PDF for stakeholders.
Typical pain-points to manage
- Account naming mismatches across entities: ensure standard chart of accounts for consolidation or create mapping.
- Excel performance: large volumes could slow down; consider Power Query or Excel’s Data Model.
- User access and training: ensure PeopleOps, Finance and business users understand slicers, filtering, refreshing.
- Data governance: ensure only authorised users edit the source templates and sync-back to QBO is controlled (since Spreadsheet Sync supports editing back to QBO). QuickBooks+1
Why PeopleOps & Business Leaders will benefit
- Faster decision-making: With “live” data, you reduce the lag between receiving financial/people data and acting on it.
- Better alignment: PeopleOps metrics (hiring, attrition, training cost) can be directly aligned to cost/revenue metrics from finance, demonstrating HR’s contribution to business outcomes.
- Scalable reporting: Instead of custom one-off reports each month, dashboards can be template-driven and refreshed automatically.
- Cross-functional insights: Finance, HR, operations all see a shared dashboard, leading to improved collaboration.
- Reduced manual effort: Less time spent exporting/copy-pasting, more time for analysis, insights and advising leadership.
How PeopleOps (Your Team) Can Help
Here are specific ways your PeopleOps team can act as the enabler of this capability in your organisation:
- Champion the metrics: Work with finance and leadership to define the “people-&-finance” KPIs that matter.
- Design dashboard templates: Use Excel (with Spreadsheet Sync data) to create PeopleOps dashboards (e.g., cost per hire, training ROI, attrition cost).
- Communicate value: Demonstrate to leadership how linking hiring cost, benefits cost, headcount growth to revenue and cost metrics helps drive business strategy.
- Train stakeholders: Provide training sessions to business users on how to use the dashboards (filters, slicers), interpret charts, ask questions.
- Continuous improvement: Monitor dashboard usage, gather feedback, iterate (add new metrics, improve layout, refine drill-down).
- Govern data governance: Ensure that dashboards remain secure, data refreshes correctly, and there’s accountability for errors.
Limitations & Considerations
It’s important to recognise some of the limitations of the Spreadsheet Sync + Excel approach so you can plan appropriately:
- The native Spreadsheet Sync is tied to Excel (Microsoft ecosystem). If your organisation uses Google Sheets or other tools heavily, you may need a different connector. LiveFlow+1
- Some users report limited flexibility in dashboard formatting when using the native templates, e.g., additional columns/rows may get wiped on refresh. LiveFlow
- For very large data sets or highly complex multi-currency, multi-entity consolidations, you may eventually need a dedicated FP&A platform beyond Excel. (But for many PeopleOps/Finance dashboards, Excel + Spreadsheet Sync will suffice.)
- Users must ensure that account naming and structure are consistent (especially for consolidation). If mismatched, manual mapping may be required.
Summary & Call to Action
If your organisation is still working with static exports, manually maintained spreadsheets, and stale dashboards, the time to upgrade is now. By leveraging QBO Advanced’s Spreadsheet Sync and building custom dashboards in Excel you can unlock live reporting that serves both Finance and PeopleOps.
Key steps to move forward:
- Audit your current reporting workflows: how much time is spent in exports, cleaning data, manual consolidation?
- Define the top 5 metrics you and your leadership care about (cost per hire, turnover rate, revenue per employee, training cost per head, etc.).
- Establish the data sources (QBO, HRIS, CRM) and plan how to connect them with Spreadsheet Sync.
- Build a proof-of-concept dashboard in Excel using live QBO data and one PeopleOps metric.
- Train your stakeholders and iterate from there.
At PeopleOps, we’re here to help you design and implement these dashboards, bridging HR, finance and business so you move faster, make better decisions and unlock the value of your people and financial data together.
Leave a Reply